go resource limits production
Last Tuesday at 3:47 AM, my phone buzzed with an alert that made my stomach drop. Our payment processing service was down. Not slow. Not degraded. Completely unresponsive.
I rolled out of bed, grabbed my laptop, and started digging through logs. The application metrics looked fine—CPU usage was at 12%, memory was barely touching 40% of allocated resources, and there were no panics or error spikes. Yet somehow, our Go service that had been humming along processing thousands of transactions per hour just… stopped accepting new connections.
What I discovered over the next four hours of debugging changed how I deploy Go services forever. The culprit? Something I’d barely given a second thought to in my years of writing Go code: operating system resource limits.
When Everything Looks Fine But Nothing Works
Here’s what made this incident particularly maddening: all my application-level monitoring showed green lights. Prometheus metrics? Normal. Error rates? Zero. Memory profiling? Nothing unusual. But customers couldn’t complete transactions, and I was getting increasingly frantic messages from the on-call team lead.
I SSH’d into the production instance and ran a simple check:
bash
curl -v http://localhost:8080/healthConnection refused. The service was running (I could see the process), but it wasn’t accepting connections. That’s when I remembered something a senior engineer had mentioned years ago during a code review: “Always check your file descriptors in production.”
I ran:
bash
lsof -p $(pgrep go-payment-svc) | wc -lThe output: 1024. Then I checked the limit:
bash
ulimit -nAlso 1024. We’d hit the ceiling.
What Most Developers Don’t Know About Go and File Descriptors
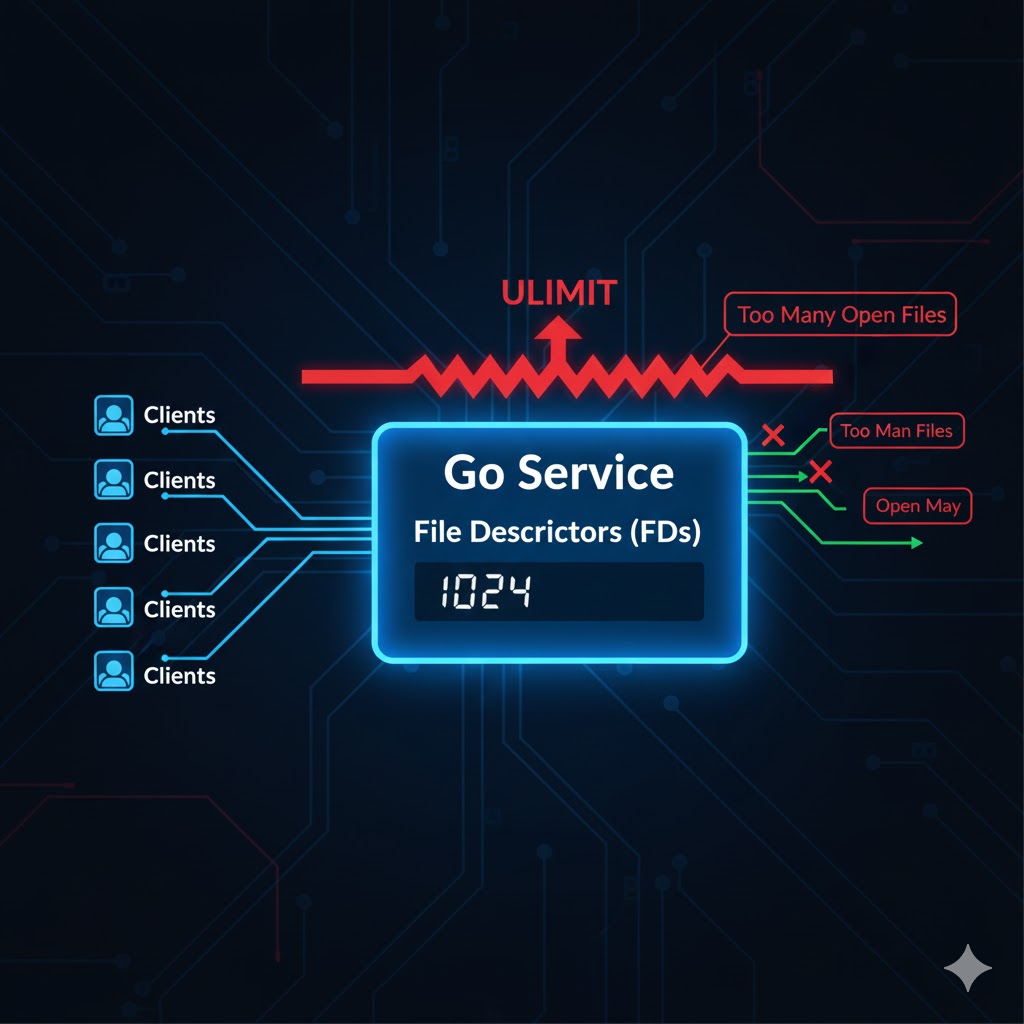
Here’s the thing about Go that bites you in production: it’s too good at what it does. The language makes it stupidly easy to handle thousands of concurrent connections with goroutines. Your application code handles it beautifully. But the operating system? It has no idea your elegant Go code exists. It just sees a process asking for more and more file descriptors.
Every TCP connection, every open file, every socket—they all consume file descriptors. And unlike memory or CPU, which trigger obvious alerts when you’re running out, file descriptor exhaustion fails silently. Your process keeps running. Your metrics look normal. But suddenly, your service can’t open new connections, can’t read configuration files, can’t do anything that requires I/O.
In our case, we were handling WebSocket connections for real-time payment updates. Each connection stayed open for an average of 45 seconds. During peak hours, we’d have thousands of concurrent connections. We’d configured our Go service beautifully—connection pools, proper timeouts, graceful shutdowns—but we’d never thought about the OS-level limits.
Understanding ulimit and RLIMIT: The Basics
The ulimit command in Unix-like systems controls the resources available to a shell and its child processes. When you type ulimit -a, you see something like this:
bash
core file size          (blocks, -c) 0
data seg size           (kbytes, -d) unlimited
file size               (blocks, -f) unlimited
max locked memory       (kbytes, -l) 64
max memory size         (kbytes, -m) unlimited
open files                      (-n) 1024
pipe size            (512 bytes, -p) 8
stack size              (kbytes, -s) 8192
cpu time               (seconds, -t) unlimited
max user processes              (-u) 5547
virtual memory (kbytes, -v) unlimitedThe one that killed us: open files (-n) 1024. This is the maximum number of file descriptors a process can have open simultaneously.
There are two types of limits:
- Soft limit: The current enforced limit. Processes can increase this up to the hard limit.
- Hard limit: The maximum value the soft limit can be set to (without root privileges).
You can check both:
bash
ulimit -Sn  <em># Soft limit</em>
ulimit -Hn <em># Hard limit</em>How to Properly Set Resource Limits for Go Services
After my 3 AM wake-up call, I developed a systematic approach to handling resource limits. Here’s what actually works in production.
1. Set Limits in systemd Service Files (Recommended)
If you’re using systemd (and you probably should be), set limits directly in your service unit file:
ini
[Unit]
Description=Payment Processing Service
After=network.target

[Service]
Type=simple
User=golang
Group=golang
ExecStart=/opt/payment-svc/bin/payment-svc
Restart=always
RestartSec=5

<em># Resource Limits</em>
LimitNOFILE=65536
LimitNPROC=4096
LimitCORE=infinity

[Install]
WantedBy=multi-user.targetThe LimitNOFILE=65536 sets both soft and hard limits for file descriptors to 65,536. This is a reasonable starting point for most Go services handling significant concurrent connections.
After modifying the service file:
bash
sudo systemctl daemon-reload
sudo systemctl restart payment-svc2. Using /etc/security/limits.conf for System-Wide Settings
For a more permanent solution that survives reboots and applies to all sessions, edit /etc/security/limits.conf:
# /etc/security/limits.conf
golang soft nofile 65536
golang hard nofile 65536
golang soft nproc 4096
golang hard nproc 4096This sets limits for the golang user (or whatever user runs your Go service). You need to log out and log back in for these changes to take effect.
3. Checking Limits at Runtime in Your Go Application
I now include a startup check in all my production Go services:
go
package main

import (
    "fmt"
    "log"
    "syscall"
)

func checkResourceLimits() {
    var rLimit syscall.Rlimit

    err := syscall.Getrlimit(syscall.RLIMIT_NOFILE, &rLimit)
    if err != nil {
        log.Printf("Error getting file descriptor limit: %v", err)
        return
    }

    log.Printf("File Descriptor Limits - Soft: %d, Hard: %d", rLimit.Cur, rLimit.Max)

    <em>// Warn if limits are too low</em>
    if rLimit.Cur < 10000 {
        log.Printf("WARNING: File descriptor soft limit (%d) is below recommended minimum of 10000", rLimit.Cur)
    }
}

func main() {
    checkResourceLimits()

    <em>// Rest of your application initialization</em>
    <em>// ...</em>
}This way, you get a clear log message at startup showing your actual limits. If something’s misconfigured, you’ll know immediately.
4. Dynamically Adjusting Limits at Runtime
In some cases, you might want your Go application to try increasing its own limits at startup:
go
func setResourceLimits() error {
    var rLimit syscall.Rlimit

    <em>// Get current limits</em>
    err := syscall.Getrlimit(syscall.RLIMIT_NOFILE, &rLimit)
    if err != nil {
        return fmt.Errorf("failed to get current limits: %w", err)
    }

    log.Printf("Current limits - Soft: %d, Hard: %d", rLimit.Cur, rLimit.Max)

    <em>// Try to increase soft limit to match hard limit</em>
    rLimit.Cur = rLimit.Max
    err = syscall.Setrlimit(syscall.RLIMIT_NOFILE, &rLimit)
    if err != nil {
        return fmt.Errorf("failed to set new limits: %w", err)
    }

    <em>// Verify the change</em>
    err = syscall.Getrlimit(syscall.RLIMIT_NOFILE, &rLimit)
    if err != nil {
        return fmt.Errorf("failed to verify new limits: %w", err)
    }

    log.Printf("New limits - Soft: %d, Hard: %d", rLimit.Cur, rLimit.Max)
    return nil
}Note: This can only increase the soft limit up to the hard limit. To increase the hard limit, you need root privileges or proper capabilities.
Monitoring and Alerting: Don’t Get Caught Again
Once bitten, twice shy. I now monitor file descriptor usage religiously. Here’s how:
Check Current File Descriptor Usage
bash
<em># For a specific process</em>
ls /proc/$(pgrep payment-svc)/fd | wc -l

<em># More detailed view</em>
lsof -p $(pgrep payment-svc) | wc -lAdd Prometheus Metrics to Your Go Service
I export file descriptor metrics from my applications:
go
import (
    "github.com/prometheus/client_golang/prometheus"
    "github.com/prometheus/client_golang/prometheus/promauto"
    "syscall"
)

var (
    fdUsage = promauto.NewGauge(prometheus.GaugeOpts{
        Name: "process_open_fds",
        Help: "Number of open file descriptors",
    })

    fdLimit = promauto.NewGauge(prometheus.GaugeOpts{
        Name: "process_max_fds",
        Help: "Maximum number of open file descriptors",
    })
)

func updateFDMetrics() {
    var rLimit syscall.Rlimit
    if err := syscall.Getrlimit(syscall.RLIMIT_NOFILE, &rLimit); err == nil {
        fdLimit.Set(float64(rLimit.Cur))
    }

    <em>// On Linux, count files in /proc/self/fd</em>
    <em>// (Simplified - production code should handle errors)</em>
    count := countOpenFDs()
    fdUsage.Set(float64(count))
}Then I set up Prometheus alerts:
yaml
groups:
  - name: resource_limits
    rules:
      - alert: HighFileDescriptorUsage
        expr: (process_open_fds / process_max_fds) > 0.8
        for: 5m
        annotations:
          summary: "High file descriptor usage on {{ $labels.instance }}"
description: "File descriptor usage is at {{ $value | humanizePercentage }}"Common Pitfalls and How to Avoid Them
Pitfall 1: Docker Container Limits
Running in Docker? The container inherits limits from the host, but you can override them:
yaml
version: '3.8'
services:
  payment-svc:
    image: payment-svc:latest
    ulimits:
      nofile:
        soft: 65536
        hard: 65536
      nproc:
        soft: 4096
hard: 4096Pitfall 2: Kubernetes Resource Limits
In Kubernetes, you need to ensure your node’s limits are propagated to pods. I set this in my deployment:
yaml
apiVersion: v1
kind: Pod
metadata:
  name: payment-svc
spec:
  containers:
  - name: payment-svc
    image: payment-svc:latest
    resources:
      limits:
        cpu: "2"
        memory: 4Gi
    <em># Note: File descriptor limits are inherited from the node</em>
<em># Ensure your nodes have adequate limits set</em>For Kubernetes, you often need to tune the node itself by modifying /etc/sysctl.conf:
fs.file-max = 2097152Pitfall 3: Connection Pool Misconfiguration
Even with high file descriptor limits, improper connection pooling can cause issues:
go
<em>// BAD: No connection limits</em>
client := &http.Client{}

<em>// GOOD: Properly configured with limits</em>
client := &http.Client{
    Transport: &http.Transport{
        MaxIdleConns:        100,
        MaxIdleConnsPerHost: 10,
        MaxConnsPerHost:     100,
        IdleConnTimeout:     90 * time.Second,
    },
    Timeout: 30 * time.Second,
}Real-World Recommendations Based on Service Type
After dealing with this across multiple projects, here are my production settings:
Low-Traffic API Service (< 100 concurrent connections):
- File descriptors: 4,096
- Processes: 2,048
Medium-Traffic Service (100-1,000 concurrent connections):
- File descriptors: 16,384
- Processes: 4,096
High-Traffic Service (1,000+ concurrent connections):
- File descriptors: 65,536
- Processes: 8,192
WebSocket/Long-Lived Connection Service:
- File descriptors: 131,072 or higher
- Processes: 8,192
The Debugging Checklist
When you suspect resource limit issues, here’s my step-by-step debugging process:
- Check if the process is running:
bash
ps aux | grep your-service- Check current file descriptor count:
bash
lsof -p $(pgrep your-service) | wc -l- Check the limits:
bash
cat /proc/$(pgrep your-service)/limits- Look for “too many open files” errors:
bash
   dmesg | grep "Too many open files"
journalctl -u your-service | grep -i "too many open files"- Check system-wide file descriptor usage:
bash
   cat /proc/sys/fs/file-nr
<em># Shows: allocated | allocated-but-unused | maximum</em>- Monitor in real-time:
bash
watch -n 1 'lsof -p $(pgrep your-service) | wc -l'The Aftermath: What I Changed Company-Wide
That 3 AM incident led to some permanent changes in how we deploy services:
- All service templates now include explicit resource limits in systemd files
- Our CI/CD pipeline checks that
LimitNOFILEis set to at least 16,384 - Every Go service includes startup logging of its resource limits
- We have Prometheus alerts for file descriptor usage above 70%
- Our runbooks include file descriptor checks as a standard troubleshooting step
The Bottom Line
File descriptor limits are one of those things you don’t think about until they bite you. And when they do, they bite hard—usually at the worst possible time, with symptoms that look nothing like what you’d expect.
Go makes it incredibly easy to write highly concurrent services, but that power comes with responsibility. You need to ensure the operating system is configured to support what your application is trying to do. It’s not enough to write good code; you need to understand the environment that code runs in.
I’ve been writing Go professionally for seven years, and I consider myself fairly experienced. But that incident taught me that there’s always something new to learn, especially at the boundary between application code and the operating system. The difference between a service that falls over mysteriously at scale and one that runs smoothly often comes down to these operational details.
Set your limits appropriately. Monitor them religiously. And maybe, just maybe, you’ll sleep through the night without a 3 AM page about connection failures.
Frequently Asked Questions (FAQ)
ulimit is a Linux command that controls resource limits for processes, including the maximum number of open file descriptors, processes, and memory. RLIMIT refers to the underlying system calls that enforce these limits. For Go services, these limits are critical because Go’s efficient concurrency model can easily create thousands of connections, and each connection consumes a file descriptor. When you hit the limit (often defaulting to 1024), your service stops accepting new connections even though it appears healthy in application metrics.
ulimit -n to see the soft limit for your current shell, or ulimit -Sn for soft limit and ulimit -Hn for hard limit. For a running process, use cat /proc/$(pgrep your-service)/limits to see all limits. To check current usage, run lsof -p $(pgrep your-service) | wc -l. In Go code, use syscall.Getrlimit(syscall.RLIMIT_NOFILE, &rLimit) to programmatically check limits at runtime.
/etc/systemd/system/), add resource limits in the [Service] section: LimitNOFILE=65536 sets the file descriptor limit, LimitNPROC=4096 sets the process limit, and LimitCORE=infinity allows core dumps. After editing the file, run sudo systemctl daemon-reload followed by sudo systemctl restart your-service. This is the recommended method because limits are explicitly defined, persist across reboots, and are clearly documented in your service configuration.
ps aux | grep your-service. Check current file descriptor count with lsof -p $(pgrep your-service) | wc -l. View all limits using cat /proc/$(pgrep your-service)/limits. Search logs for errors with journalctl -u your-service | grep -i "too many open files". Check system-wide usage with cat /proc/sys/fs/file-nr. Monitor in real-time using watch -n 1 'lsof -p $(pgrep your-service) | wc -l'. Compare current usage against limits to identify if you’re hitting the ceiling.
docker-compose.yml file under the service definition: ulimits: nofile: soft: 65536, hard: 65536, nproc: soft: 4096, hard: 4096. For docker run commands, use --ulimit nofile=65536:65536. Docker containers inherit limits from the host by default, but explicit configuration ensures consistency across environments. Remember that the host system must have adequate limits set, or container limits will be capped at the host’s maximum values.
syscall.Getrlimit(syscall.RLIMIT_NOFILE, &rLimit) to get current limits, then modify rLimit.Cur (soft limit) and use syscall.Setrlimit(syscall.RLIMIT_NOFILE, &rLimit) to apply changes. However, you can only increase the soft limit up to the hard limit without root privileges. This approach is useful for ensuring your application has adequate resources at startup, but setting limits in systemd or container configuration is more maintainable and explicit for production deployments.
process_open_fds and process_max_fds gauges that track current usage and limits. Set up alerts when usage exceeds 70-80 percent of the limit. Use system monitoring tools like lsof to track file descriptors per process. In your Go application, log resource limits at startup using syscall.Getrlimit for visibility. Monitor trends over time to identify leaks or unexpected growth. Include file descriptor checks in your standard incident response runbooks so on-call engineers know to check this during outages.
LimitNOFILE=65536, it sets both soft and hard limits to the same value. This distinction matters because applications can programmatically adjust their soft limits at runtime to optimize resource usage without requiring configuration changes or restarts.
Don't Miss Out on Expert Insights!
Join 10,000+ smart readers who get our best articles, exclusive tips, and actionable strategies delivered straight to their inbox. No spam, no fluff—just valuable content you can't find anywhere else. Plus, get our free guide when you subscribe today!